Go to: 10.5.2019 to 16.5.2019 or 24.5.2019 to 30.5.2019
Weekly Overview for the week of 17.5.2019 to 23.5.2019.
Graphs Average Values Minimum Values Maximum Values All Values
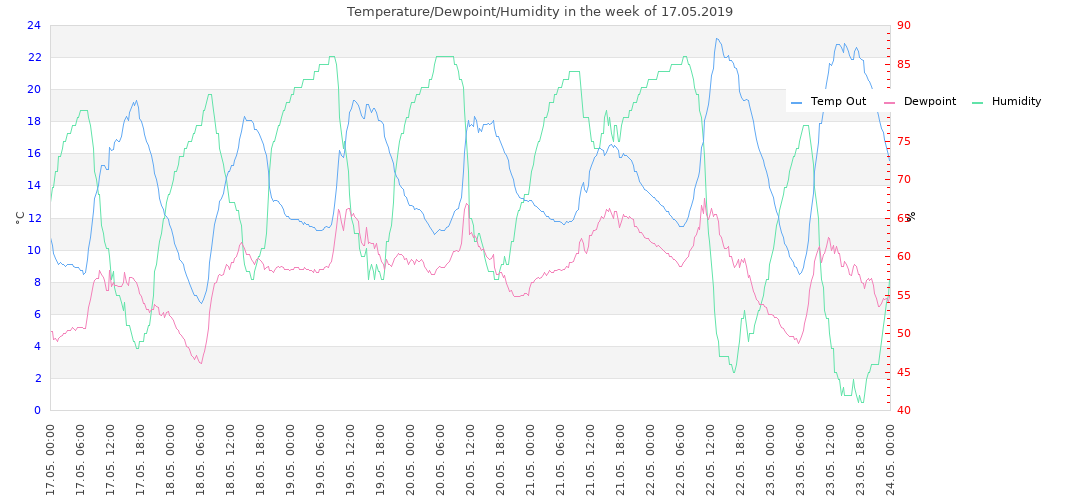
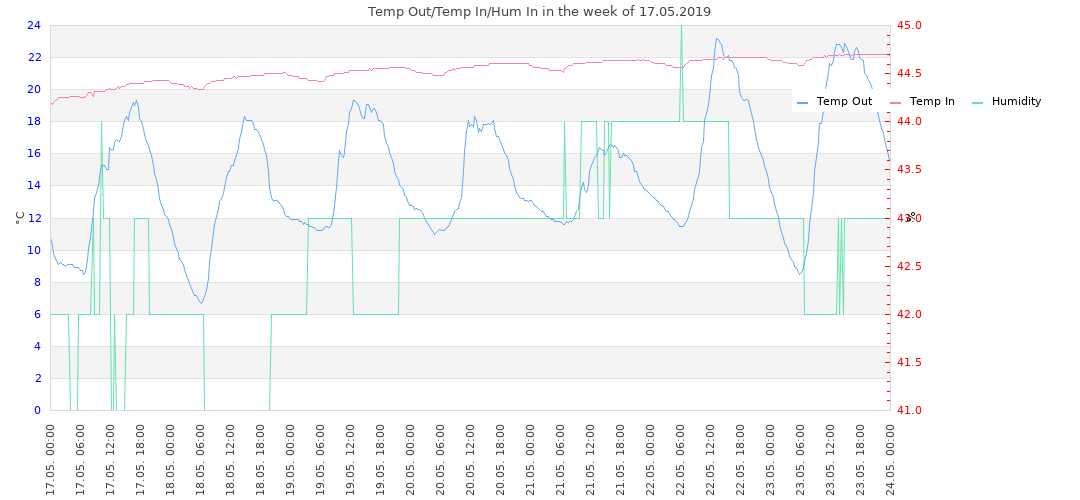
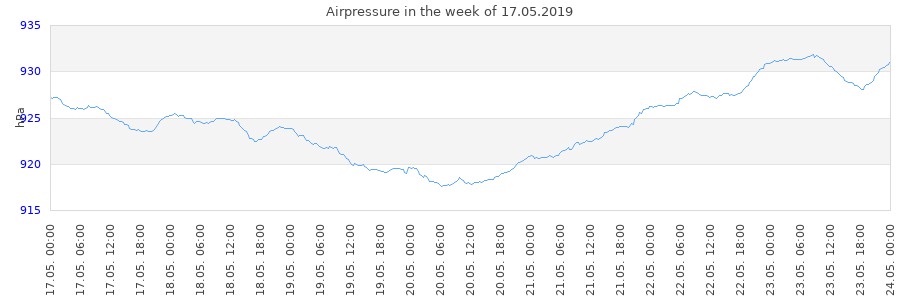
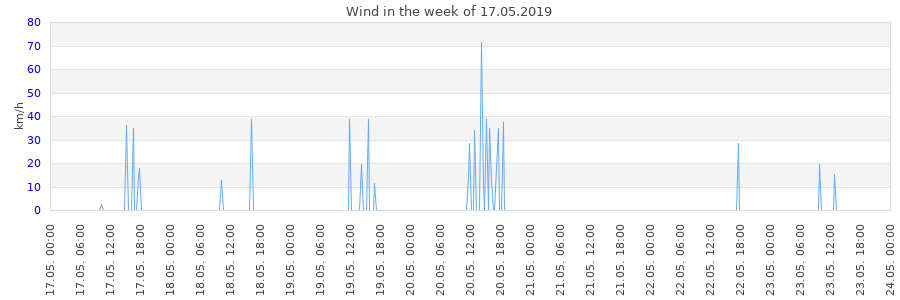
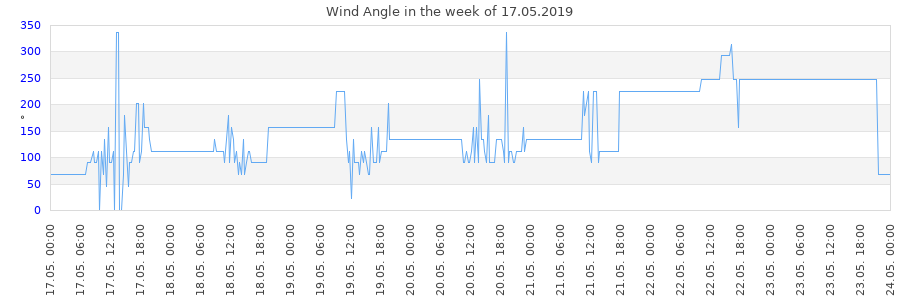
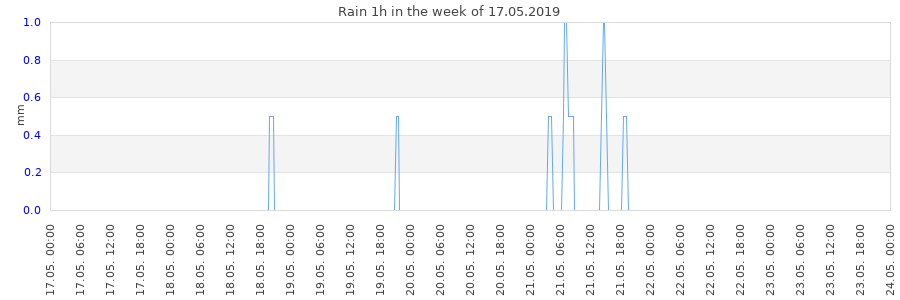
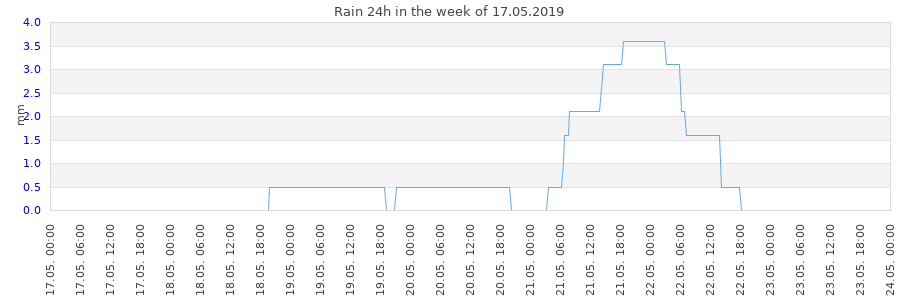
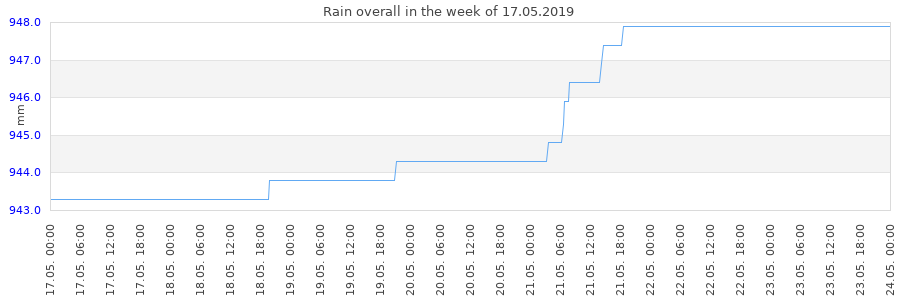
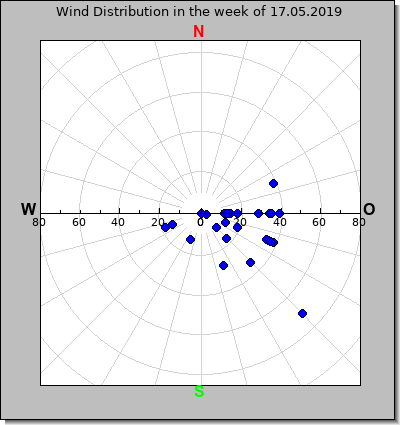
Graphs for the week of 17.5.2019 to 23.5.2019.
Top
Average Values for the week of 17.5.2019 to 23.5.2019.
| Date | Time | Temp In (°C) | Temp Out (°C) | Dew (°C) | Hum In (%) | Hum Out (%) | Windspeed (m/s) | Wind Angle (°) | Wind Chill (°C) | Airpressure (hPa) | Rain 1h (mm) | Rain 24h (mm) | Rain overall |
| --.--.-- | --:--:-- | 0.00 | 0.00 | 0.00 | 0.00 | 0.00 | 0.00 | 0.00 | 0.00 | 0.00 | 0.00 | 0.00 | 0.00 |
Top
Minimum Values for the week of 17.5.2019 to 23.5.2019.
| Temp In (°C) | Temp Out (°C) | Dew (°C) | Hum In (%) | Hum Out (%) | Windspeed (m/s) | Wind Angle (°) | Wind Chill (°C) | Airpressure (hPa) | Rain 1h (mm) | Rain 24h (mm) | Rain overall |
| 0.00 | 0.00 | 0.00 | 0.00 | 0.00 | 0.00 | 0.00 | 0.00 | 0.00 | 0.00 | 0.00 | 0.00 |
Top
Maximum Values for the week of 17.5.2019 to 23.5.2019.
| Temp In (°C) | Temp Out (°C) | Dew (°C) | Hum In (%) | Hum Out (%) | Windspeed (m/s) | Wind Angle (°) | Wind Chill (°C) | Airpressure (hPa) | Rain 1h (mm) | Rain 24h (mm) | Rain overall |
| 0.00 | 0.00 | 0.00 | 0.00 | 0.00 | 0.00 | 0.00 | 0.00 | 0.00 | 0.00 | 0.00 | 0.00 |
Top
Show all values
Go to: 10.5.2019 to 16.5.2019 or 24.5.2019 to 30.5.2019